
See also
Film about the BCL's missions and tasks

The Banque centrale du Luxembourg informs that, based on preliminary data, the aggregated balance sheet of credit institutions reached 766 806 million euros on 30 November 2015, compared to 761 006 million euros on 31 October 2015, an increase of 0.8%. Between the months of November 2014 and November 2015, the aggregated balance sheet increased by 1.5%.
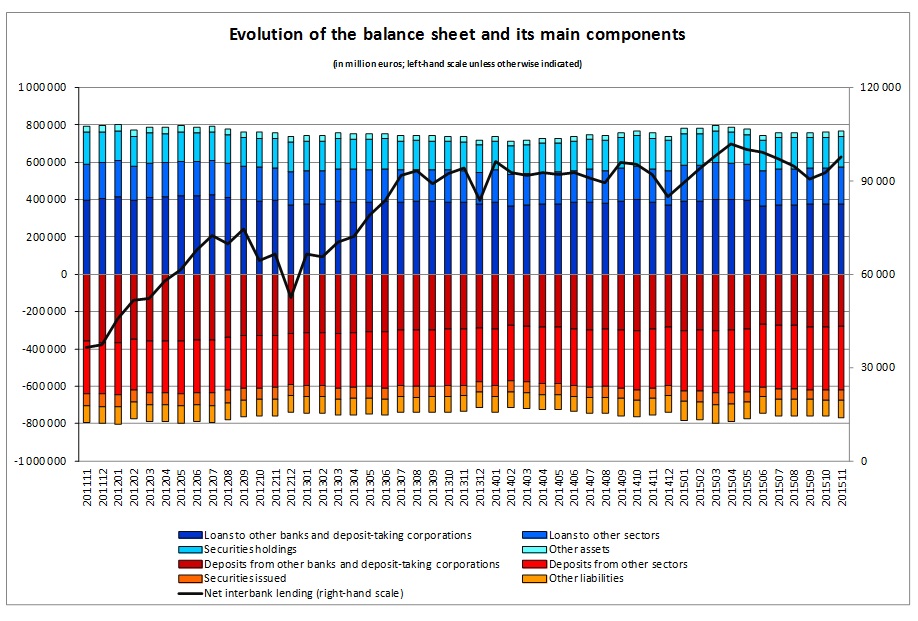
Over the last twelve months, assets mainly increased in light of a progression in loans to non-bank customers, which rose by 10.6% between November 2014 and November 2015. Over the same period, the rise in liabilities was largely due to deposits from non-bank customers, which rose by 8.2%.
It should be noted that interbank loans and deposits represent the main balance sheet components on the asset and liability side, making up 49.0% and 36.3% respectively. Against this background, it should be pointed out that net interbank lending, that is to say the difference between interbank loans and deposits, remained positive and reached 97 614 million euros at the end of November 2015.
Loans to resident non-bank customers rose by 580 million euros, or 0.8%, between October and November 2015. Between November 2014 and November 2015, these loans increased by 2 840 million euros (4.1%).
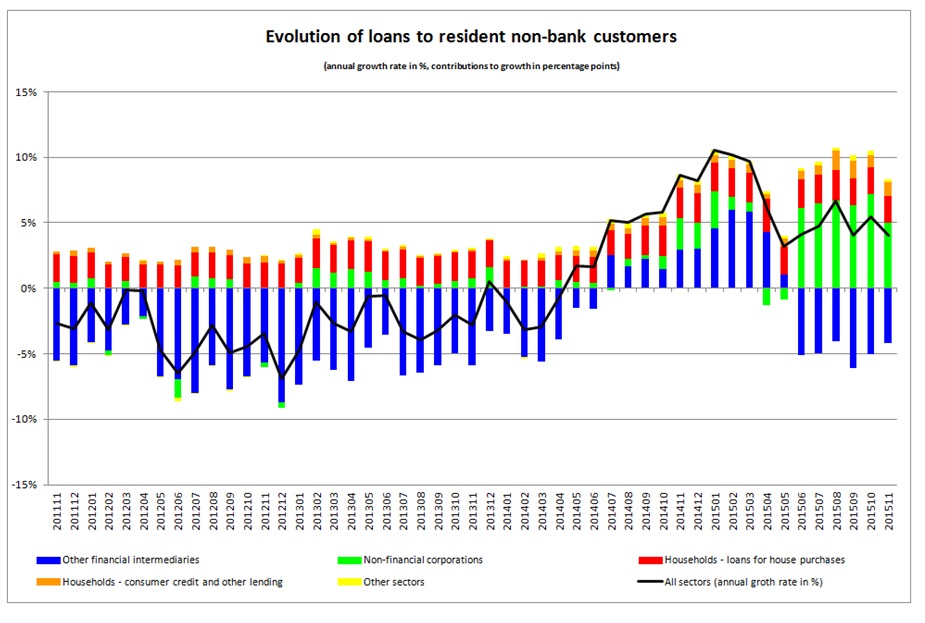
The progression of loans to resident non-bank customers was largely attributable to its main components, that is to say loans to non-financial corporations (NFCs), loans to other financial intermediaries (OFIs) and lending to households for house purchases. At end-November 2015, the respective shares of these loans stood at 26.1%, 29.5% and 33.1%. While loans to NFCs and loans for house purchases continued to progress between November 2014 and November 2015, OFI-lending significantly moderated the increase in loans to the resident non-bank sector. Indeed, between November 2014 and November 2015, loans to NFCs rose by 3 499 million euros (22.7%) and loans for house purchase by 1 409 million euros (6.2%), while OFI-lending dropped by 2 932 million euros, or 12.1%.
With regard to the liability side, deposits from the resident non-bank sector went up by 216 million euros (0.1%) between 31 October and 30 November 2015. On an annual basis, these deposits rose by 20 022 million euros, or 10.2%.
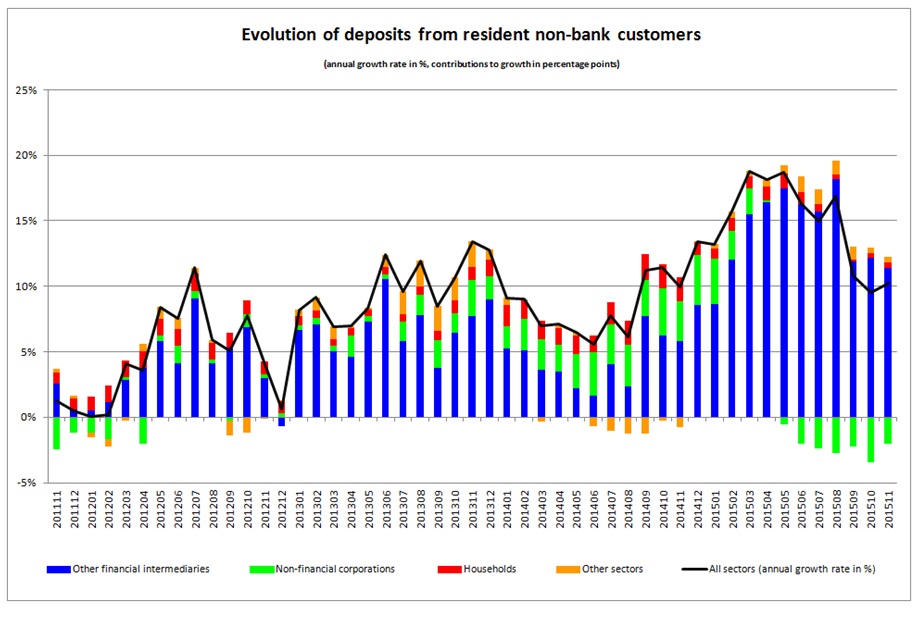
Between November 2014 and November 2015, the progression of deposits from the resident non-banking sector was largely attributable to its main component, that is to say deposits from the OFI sector, with a share of 70.5% as at 30 November 2015. Indeed, the year-on-year increase in deposits from the resident non-banking sector was largely due to a rise in OFI deposits, which comprise deposits made by monetary and non-monetary investment funds. Over the last twelve months, resident OFI deposits rose by 22 375 million euros, or 17.2%. With regard to other sectors, resident household deposits increased by 837 million euros, or 2.7%, while resident NFC deposits went down by 3 973 million euros (18.6%).
Finally, it should be noted that 143 credit institutions were officially registered in Luxembourg at end-November 2015.
The tables pertaining to the balance sheet of credit institutions can be consulted on the BCL’s website on the following pages: http://www.bcl.lu/en/statistiques/series_statistiques/11_etablissements_credit/index.html
Explanatory note
In order to better inform the public, the Banque centrale du Luxembourg has decided to restructure its press release on the evolution of balance sheet data. Thus, in the future, the monthly press release will only cover credit institutions and will present additional information on the main balance sheet components, with regard to assets as well as liabilities. In addition, the press release will provide additional information on the credit and deposit activities of resident counterparties. The charts present the sectorial contributions (in percentage points) to the annual progression of loans and deposits, respectively. This representation takes into account the relative weight of a given economic sector and highlights its impact on the annual progression of a given time series.
