
Useful links
- European Central Bank publications
15.07.2021
Blog post by Gaston Reinesch, Governor of the BCL
The recent months saw a substantial increase in measured headline inflation in the euro area. This article takes a succinct look at recent inflation developments, both for the euro area and Luxembourg. The Governing Council’s definition of price stability refers to the euro area HICP, a consumer price index closely measuring the change over time in the price of a representative basket of household consumer expenditures (covering goods and services), rather than single prices or a narrow set of prices. The Governing Council’s reference to the full HICP (and the derived headline inflation) underlines its aim to protect agents from a loss in the purchasing power of money.
The HICP is compiled by Eurostat and the national statistical institutes (such as Statec collecting prices of consumer goods and services in Luxembourg) according to harmonised definitions.[2] It covers 12 main categories of household consumption, i.e. food, alcohol and tobacco, clothing, housing, household equipment, health, transport, communication, recreation and culture, education, hotels and restaurants and miscellaneous goods and services.
In order to produce reliable results, national HICPs are calculated based on weights for goods and services reflecting their relative relevance for household consumption expenditures.[3] The weights are revised yearly and released with the data for the month of January. The euro area HICP aggregate is compiled as a weighted average of the Member States whose currency is the euro. The country weights are derived from National Accounts data for household final consumption expenditure expressed in euros.[4]
On June 17, 2021, Eurostat released inflation readings for May 2021. Conceptually, changes in the general price level can be expressed in various forms which, at first glance may provide different signals at times:
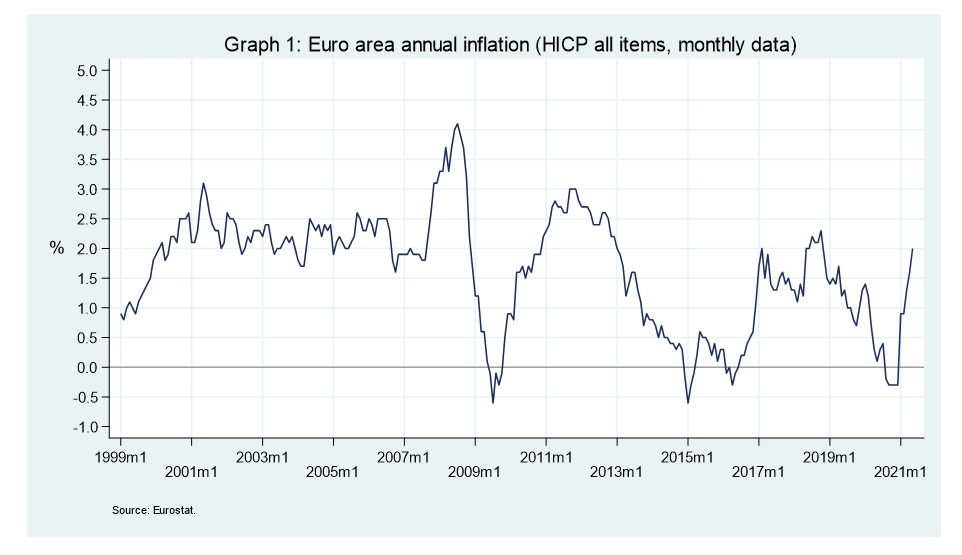
The euro area annual inflation rate of 2.0% in May 2021, per se, is of limited significance for monetary policy. A forward-looking monetary policy strategy needs to identify the forces driving inflation and assess whether the inflation outlook is robustly converging to the inflation objective. Looking back, Eurostat reported an annual inflation rate (monthly data) of below 2 per cent between November 2018 and April 2021 (see graph 1).
To better identify the factors that determine consumer price developments and to assess their policy implications, the full HICP is typically broken down into “special aggregates” (such as indices for goods, services and energy as well as indices excluding selected components such as energy and unprocessed food). So-called “core” inflation indices, excluding more volatile components from the full HICP, can provide complementary information about underlying price developments and are continuously monitored by the Eurosystem.
Focusing on the most recent experience, the annual inflation rate (as measured by the annual rate of change in the HICP) in euro area food prices stood at 0.5% while energy prices rose by 13.1% in May 2021 (see Graph 2 below). In Luxembourg, the range of the annual rate across components was even more pronounced (ranging from +1.0% for food and +30.7% for energy). The annual rate of change varied substantially across countries too, ranging from -1.2% in Greece to +4.0% in Luxembourg.
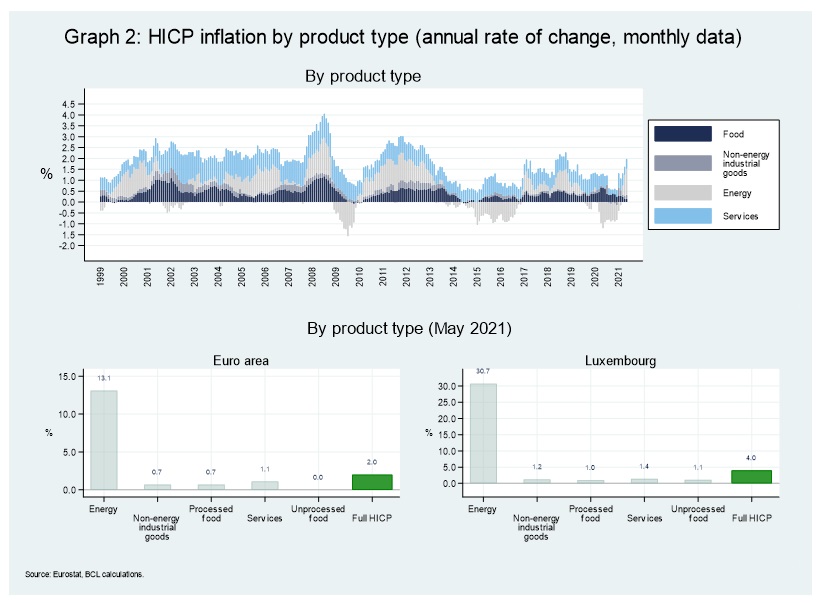
Energy prices contributed by far the most to the overall HICP inflation rate in May 2021. In spite of its relatively small weight in the euro area HICP (almost 10%), energy prices contributed almost 1.2 percentage point to the overall HICP inflation rate of 2.0% in May 2021 (see graph 2). Services contributed 0.45 percentage point to overall euro area inflation (weight in euro area HICP approximately 42%). Food prices (approximately 22% weight in euro area HICP) and prices of non-energy industrial goods (accounting for approximately 27% of euro area HICP) contributed almost 0.2 percentage point to euro area HICP inflation each.
While energy prices rose substantially over the previous 12 months they are closely related to crude oil price movements. Furthermore, they are typically subject to substantial volatility and not necessarily indicative of price stability over the medium term. The strong increase in energy prices that contributed substantially to euro area HICP inflation more recently, must be seen against the background of the very substantial decline in prices of energy-related HICP items in early 2020. In May 2020, for instance, energy prices contributed approximately -1.2 percentage point to euro area HICP inflation. The recent rise in energy prices largely undid the drop in energy prices recorded in early 2020.
Inflation developments in 2020 and 2021 highlight that one-off factors may temporarily affect measured inflation rates and render the assessment of risks top price stability more difficult. In Germany, for instance, VAT rates had been temporarily lowered during the COVID-19 pandemic and raised again in January 2021.[6] Moreover, the rise in headline inflation witnessed in 2021 also reflects an increase in input costs related to supply disruptions the duration of which is largely unknown at the current juncture.
Unlike energy prices, other product types (i.e. processed and unprocessed food as well as services and non-energy industrial goods) witnessed a small rise in the level of prices, between 0 and 1.1 per cent in the euro area and between 1.0 and 1.4 percent in Luxembourg. The absence of a robust convergence of the inflation outlook to the inflation objective is not only reflected in subdued underlying inflation dynamics, but also in the latest June 2021 Eurosystem staff macroeconomic projections. Driven by temporary upward factors, the annual average inflation rate is expected to rise – according to these projections – to 1.9% in 2021 but to decline later on to 1.4% - 1.5% in 2022 and 2023.
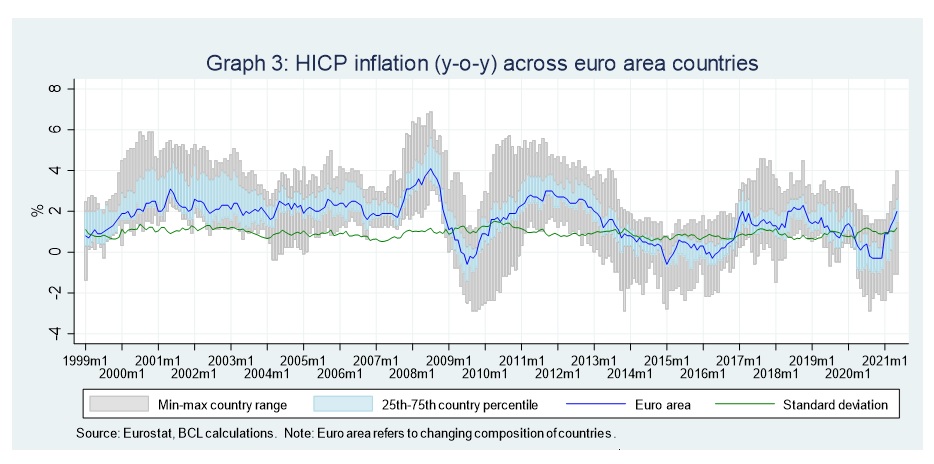
Overall euro area HICP inflation at times can mask different developments in the level of prices both across types of consumption products and across countries. The current dispersion of headline inflation rates across euro area countries is not negligible (the annual rate of change in the HICP in Luxembourg exceeding the one for Greece by 5.2 percentage points in May 2021). From a longer-term perspective, the current spread between national inflation rates is relatively large but not exceptional (see Graph 3). The range exceeded 7 percentage points in the second quarter of 2010. To account for the different composition of the euro area over time, the chart also plots the standard deviation of annual HICP inflation rates across euro area countries. It shows that the variation of inflation rates across countries in the euro area has not significantly changed since 1999.
There are many reasons for inflation differentials in a currency area. These could be broadly classified as the result of (i) the convergence process, (ii) business cycle differentials, (iii) asymmetric shocks or asymmetric responses to common shocks and (iv) wage and price rigidities as well as other national labour and product market characteristics.
Countries “catching up” with relatively more advanced countries often experience higher inflation rates. Relatively less advanced countries typically have lower price levels. As they “catch up” with relatively more advanced countries, their real exchange rate appreciates, which can be achieved either through nominal exchange rate appreciation or positive inflation differentials (or both).[7]
Inflation differentials can also be a result of ordinary macroeconomic adjustment processes in a currency area. In a monetary union without the possibility of nominal exchange rate adjustment and with relatively poor labour mobility, such as in the euro area, inflation differentials allow individual economies to adjust to asymmetric shocks. For example, countries with low competitiveness can improve their position through relatively lower inflation rates.
At the same time, inflation differentials could also be destabilising, in particular if they were persistent. The example above suggested that countries that need to regain competitiveness might need to undergo internal devaluation with inflation rates below those of their competitors. In normal times, euro area inflation rates close to 2% might provide sufficient space for adjustment. However, in periods of persistently low inflation or large imbalances, the adjustment mechanism might lead to negative inflation rates in some countries with a risk of a dangerous deflationary spiral.[8]
Large inflation differentials can complicate the conduct of monetary policy. Differences in inflation rates across countries translate into differences in real interest rates given that key (nominal) policy rates are the same across the euro area. This might have destabilizing effects as countries with higher inflation rates experience lower real interest rates, which in turn stimulate demand and might lead to even higher inflation rates.[9]
Graph 4 plots inflation differentials for the current 19 euro area countries across different periods of time (measured as the difference between inflation rates in individual countries and the weighted average of 19 countries). Prior to the global financial crisis (GFC), inflation differentials were positive and relatively large in two groups of countries: (i) euro area countries with at that time increasing macroeconomic vulnerabilities and (ii) new EU member states catching up with the euro area. The GFC led to a correction of macroeconomic imbalances and a sharp reduction of inflation differentials. In the last three years, we observe increasing negative inflation differentials, often in the same countries that were experiencing large positive differentials prior to the GFC.
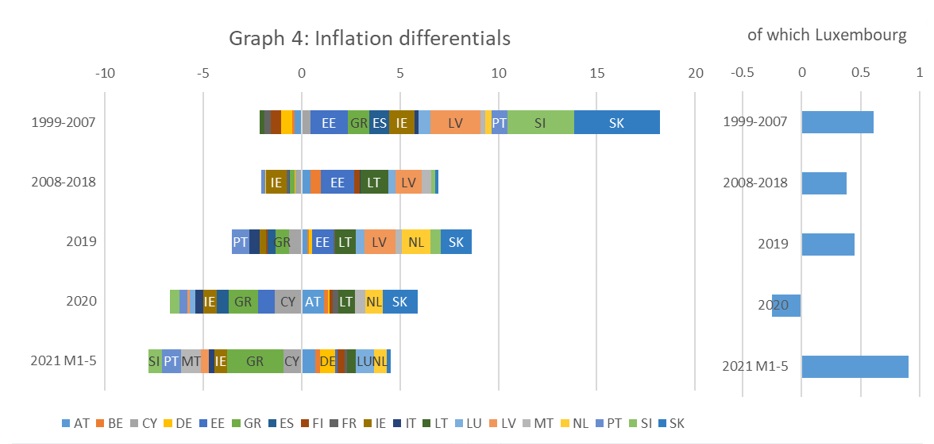
Note : Bars denote differences between HICP inflation rates in each individual country and the weighted average of HICP inflation rates in 19 euro area countries. Averages over time.
Source : Eurostat, BCL calculations.
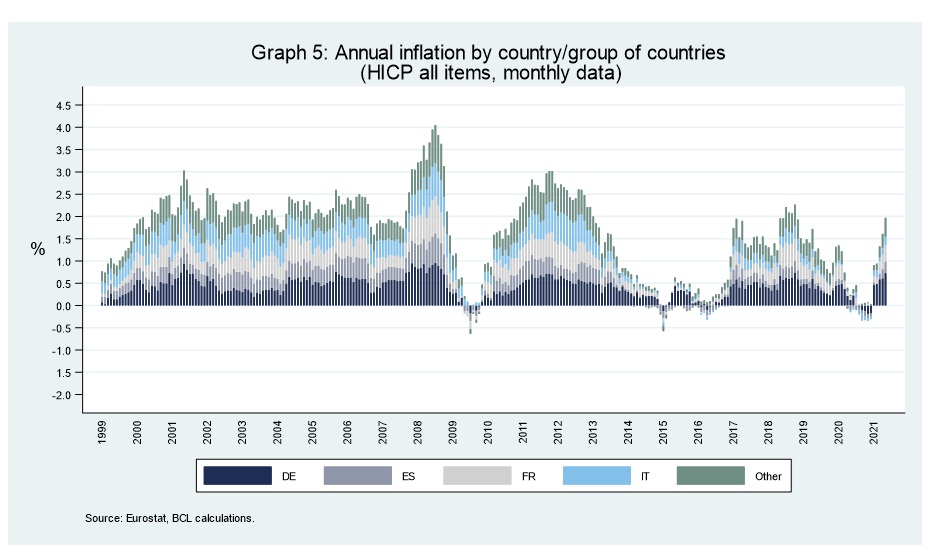
The dispersion in inflation rates also translates into different contributions of countries to euro area HICP inflation (see Graph 5). In May 2021, consumer prices in France and Germany, whose combined weight in the euro area HICP is approximately 50%, contributed almost 1.1 percentage point to euro area HICP inflation.
The sudden rise in HICP inflation reported by Eurostat in January 2021 not only owed to the unwinding of previous declines in energy prices (and changes in tax rates). It partly also reflected the change in the weights used to aggregate price developments to the overall HICP. As indicated above, in order to keep the price index representative of consumers’ spending choices, HICP weights are updated annually and released with the data for the month of January.
The weights used to calculate the HICP in the current year y are supposed to be representative of consumer expenditures incurred in the previous year y-1. In general, consumption patterns do not change significantly between two subsequent years, therefore the move towards a new set of consumption weights in January does not affect the level of the HICP and/or the derived inflation rate much. However, since January 2021 the HICP reflects the spending patterns during the pandemic, which substantially affected the structure of consumption both in the euro area and in Luxembourg. Owing to measures aiming to contain the impact of the pandemic, consumers refrained from or were not supposed to stick to their previous consumption patterns. While the weight of restaurant and transportation spending in the consumption basket, for instance, had declined, the relative importance of groceries and domestic electricity had increased.
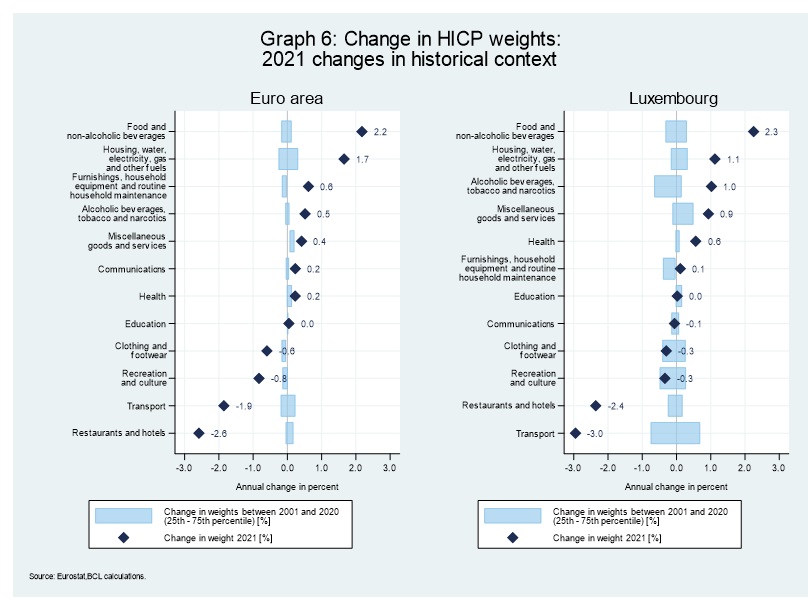
The changes in consumption patterns triggered by the pandemic (as reflected by the change in HICP weights between 2020 and 2021, see blue diamonds in Graph 6) were substantial compared to the changes observed over the two last decades (see blue bars in the graph above). This relatively larger change in consumption patterns implied that the price index for 2020 (based on consumption patterns for 2019) had become a less representative measure of actual consumption. This atypical structure of consumer expenditures in much of 2020 are reflected in the HICP weights starting January 2021.
Between early 2020 and early 2021, on average consumption items with a stronger increase in weights saw a higher increase in the inflation rate. A counterfactual exercise assuming no change in the HICP weights between 2020 and 2021 suggests that the change in weights had an upward impact on HICP inflation in January and February 2021 (see Graph 7) . More specifically, the official HICP euro area inflation rate reported by Eurostat for January 2021 and February 2021 exceeded the counterfactual inflation rates by approximately 0.3 and 0.2 percentage points, respectively. Put differently, the 0.9 per cent annual inflation rate reported for the months of January and February 2021 masked an inflation rate of 0.6% and 0.7%, respectively if the 2020 weights had been used. The impact of the exceptional change in the HICP weights on the measured inflation rate depends on various factors, including price developments in the various components of the HICP and changes of consumption patterns. By May 2021, the counterfactual analysis suggests, the impact had turned slightly negative for the euro area (implying that the published annual inflation rate for the euro area was below the rate obtained assuming no change in the weights between 2020 and 2021).
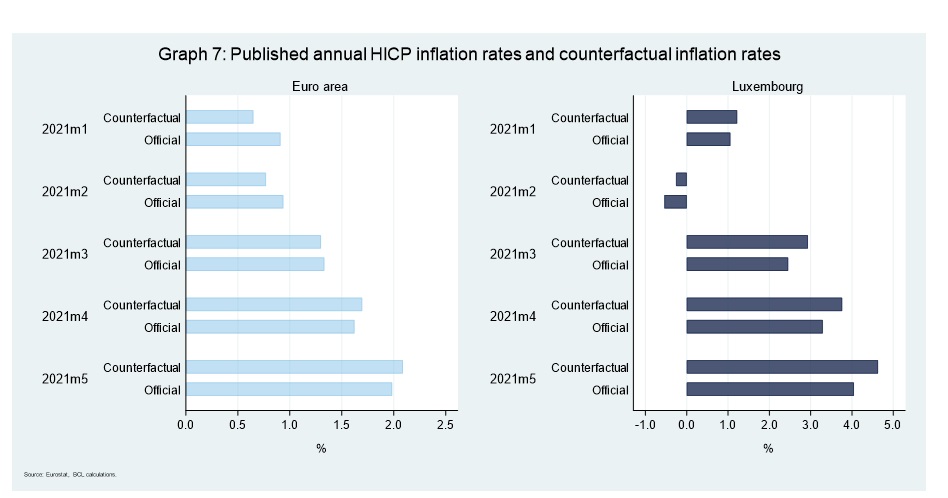
For Luxembourg, so far, the counterfactual inflation rate was higher than the published inflation rate. The counterfactual simulation suggests an inflation rate slightly higher than the published one and the gap between the two increased in recent months.
Going forward, depending on the future evolution of the pandemic, HICP weights for the current year 2021 (based on 2020 consumption patterns) may again turn out an imperfect representation of actual consumption in 2021 and/or 2022. Moreover, substantial changes in consumption patterns may also add to the uncertainty surrounding inflation projections which typically assume unchanged weights over the projection horizon.
[1] This article draws on HICP (Harmonised Index of Consumer Prices) data disseminated by Eurostat by the cut-off date June 28, 2021. Concluding on the basis and within the limits of full HICP releases, this article does not include early estimates (called “HICP flash estimates”).
[2] While HICPs for single countries are produced by national statistical institutes, HICPs for country-group aggregates (e.g. the euro area and the EU) are produced by Eurostat. Prices may be collected in various ways, such as visits to local retailers and service providers or by means of central collection via mail, telephone, email, the internet and administrative data sources.
[3] Such weights can be derived from various data sources, such as National Accounts data and household budget surveys.
[4] Household final monetary consumption expenditure denotes final consumption expenditure by households, in monetary transactions, on the economic territory of the Member State, on products that are used for the direct satisfaction of individual needs (Article 2(20) of Regulation No 2016/792).
[5] On June 30, 2021 Eurostat released HICP flash estimates according to which euro area annual inflation is expected to be 1.9% in June 2021. Concluding on the basis and within the limits of Eurostat’s full HICP releases by the cut-off date (June 28, 2021), however, this article does not include early estimates.
[6] Since many businesses were closed during the pandemic, however, there is uncertainty as to whether the impact of adjustments to the VAT rate can be fully reflected in German consumer price statistics (Deutsche Bundesbank Monatsbericht Januar 2021).
[7] This explanation of inflation differentials is known in the literature as the Balassa-Samuelson effect.
[8] In a deflationary spiral consumers postpone spending on durable goods and business cut back on investment as prices are expected to decline. Lower demand leads to further price cuts. Since wages are difficult to cut, real wages increase and profits and employment decline. In addition, the real burden of nominal debt increases.
[9] The effect might be mitigated by eroding competitiveness implied by higher inflation rates.