
Lien utile
- Publications de la Banque centrale européenne
14 juillet 2026
Post de Gaston Reinesch, Gouverneur de la BCL
On 11 June 2026, the ECB Governing Council decided to increase key ECB interest rates by 25 bps against the backdrop of a sudden and severe energy shock triggered by the war in the Middle East. Data and updated staff projections available at the Governing Council meeting in June pointed to a more persistent inflation overshoot than previously expected. The Governing Council judged that a measured increase in policy rates was necessary to prevent the shock from becoming embedded in inflation dynamics and to safeguard price stability. This blog post highlights developments and considerations that informed the Governing Council’s deliberations at its June 2026 monetary policy meeting based on the June 2026 staff projections and evidence available at that time. This blog post was finalised on 2 July 2026 and deliberately abstracts from developments and data releases that materialised after the June 2026 Governing Council meeting.
The closure of the Strait of Hormuz and the damage to critical energy production facilities in the region disrupted energy markets, triggering sharp increases in the price of crude oil and other commodities originating in the Persian Gulf (see Graph 1 below). Although Brent crude prices and refining margins declined in the second half of May 2026, by the June 2026 Governing Council meeting, they remained approximately 30% and 60% above their levels observed before the war in the Middle East, respectively. Dutch TTF natural gas prices were comparatively stable through May, but still stood more than 50% above their pre-war level at the time of the June Governing Council meeting.
Graph 1: High-frequency upstream indicators of inflationary pressures
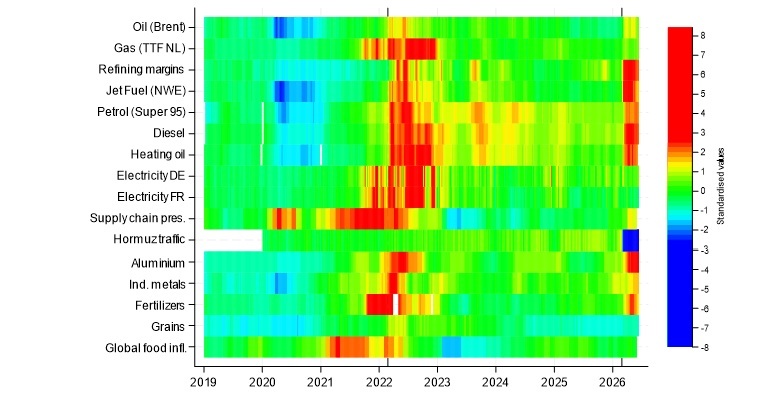
Note: Weekly data in levels except for global food price inflation. Standardised values (z‑scores) based on 2010–2026 sample. Natural gas prices from Dutch virtual trading point TTF. Refining margins based on Hydrocracker Unit (HCU) method using Brent. Jet Fuel cargo prices for delivery in North West Europe. Euro area petrol, diesel and heating oil prices are collected by the European Commission (EC) and include taxes. Electricity prices are OTC baseload forward prices for delivery on high voltage grid one day ahead. Global supply chain pressure index by the Federal Reserve Bank of New York. Hormuz traffic is the number of commercial vessels passing the Strait of Hormuz with AIS transponders turned on. Prices of industrial metals and grains are based on Bloomberg commodity subindices. Fertilizers are a simple average of Baltic Sea Urea, UAN32 and ammonium. Global food inflation based on UN Food and Agriculture World Food Price Index. Vertical dashed lines denote Russia’s invasion of Ukraine in February 2022 and the start of the war in the Middle East in February 2026.
Source: Bloomberg, Eurostat, EC, ECB, Federal Reserve Bank of New York, BCL calculations. Latest obs.: 4 June, 2026.
The June 2026 Eurosystem staff projections provided an updated assessment of the euro area inflation and growth outlook.
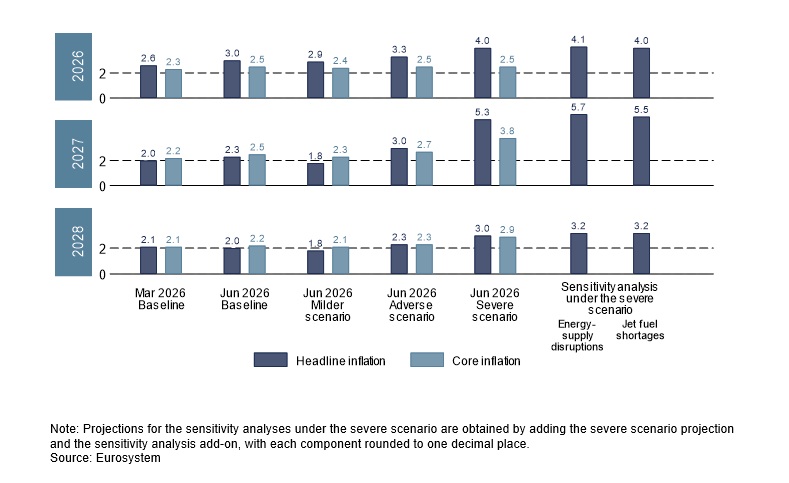
At the time the projections were finalised[2], the war in the Middle East remained a major source of uncertainty, prompting Eurosystem staff to complement the baseline projection with a set of illustrative alternative scenarios (i.e. a “milder scenario”, an “adverse scenario” and a “severe scenario”). While no probabilities were assigned to these scenarios, they provided an indication of the broad range of possible outcomes for inflation and growth. They differed from the baseline in three main respects: the size of the energy shock, the degree of uncertainty, and the strength of the transmission of the energy shock to non-energy prices.[3] Sensitivity analyses under the severe scenario further examined the implications of two prominent risks, namely, energy-supply disruptions and jet fuel shortages.
Based on the evidence available by the cut-off date, Eurosystem staff revised up the baseline projection for headline inflation to 3.0% in 2026 and 2.3% in 2027 (from 2.6% and 2.0%, respectively, in March 2026, see Graph 2 below). While the projection for 2028 was slightly revised down to 2.0% (from 2.1% in March), headline inflation could be significantly higher in the adverse and severe scenarios. Projections for core inflation were revised up to 2.5% for both 2026 and 2027 (from 2.3% and 2.2%, respectively) and 2.2% for 2028 (from 2.1%). Annual average headline inflation was projected to remain above 2% in most projection years and scenarios considered (save for 2028 under the baseline and for 2027-2028 under the milder scenario). Core inflation was projected to remain above 2% in all projection years and all scenarios.
Graph 2: June 2026 staff inflation projections by projection year and scenario (in per cent)
While the June projections implied a sizeable upward revision to headline and core inflation for 2026 and 2027, growth was revised only modestly. On account of a stronger than expected impact of the war in the Middle East, staff revised down growth for both 2026 and 2027 by 0.1 percentage points, but revised up growth for 2028 by 0.1 percentage points. According to the June baseline, the euro area economy was projected to grow by 0.8% in 2026, 1.2% in 2027, and 1.5% in 2028. Growth would be lower in 2026-2027 under the adverse and severe scenarios, but slightly higher in 2027-2028 under the milder scenario.
Staff projections rely on a set of technical assumptions based on an agreed methodology.[4] Short-term interest rates (3-month Euribor), for instance, are assumed to evolve in line with prevailing market expectations, derived from futures rates. At the cut-off date of the June 2026 staff projections, markets expected a rise in the 3-month Euribor from 2.2% in 2025 to 2.4% in 2026, 2.8% in 2027 and 2.7% in 2028.[5] In normal times, the 3-month Euribor typically evolves in close vicinity to the Eurosystem’s main policy rate.[6] Accordingly, the June 2026 projections were contingent on market expectations of a tighter monetary policy throughout the projection horizon relative to 2025 (when the Eurosystem’s deposit facility rate stood between 2.0% and 3.0%).
As for previous projection exercises, staff also considered risks to the outlook under the baseline scenario derived from sensitivity analyses based on alternative paths for energy commodity prices and the USD/EUR exchange rate.[7] Alternative paths for energy commodity prices indicated significant upside risks for inflation, especially in the short term, and downside risks to growth. Alternative exchange rate paths suggested the possibility of a further appreciation of the euro, especially over the medium term, thereby pointing to some downside risks to growth and inflation. Overall, the full set of scenarios and sensitivity analyses pointed to downside risks for euro area growth and upside risks for inflation.
Similar to the June Eurosystem staff projections, other institutions and the private sector foresaw inflation above the medium-term target over a significant period of time, projecting headline inflation above 2% for 2026 and 2027 (IMF also for 2028) and core inflation above 2% throughout the projection years (see table below).
Table: Forecasts by other institutions and the private sector
|
|
Release date |
Real GDP growth |
HICP inflation |
HICP inflation excl. energy and food |
||||||
|
|
2026 |
2027 |
2028 |
2026 |
2027 |
2028 |
2026 |
2027 |
2028 |
|
|
European Commission |
May 2026 |
0.9 |
1.2 |
- |
3.0 |
2.3 |
- |
2.3 |
2.5 |
- |
|
Consensus Economics |
May 2026 |
0.8 |
1.2 |
1.4 |
2.9 |
2.2 |
1.9 |
2.3 |
2.2 |
- |
|
Survey of Professional Forecasters |
May 2026 |
1.0 |
1.3 |
1.3 |
2.7 |
2.1 |
2.0 |
2.2 |
2.2 |
2.1 |
|
OECD |
June 2026 |
0.8 |
1.2 |
- |
2.8 |
2.4 |
- |
2.4 |
2.4 |
- |
|
International Monetary Fund |
April 2026 |
1.1 |
1.2 |
1.4 |
2.6 |
2.2 |
2.1 |
- |
- |
- |
Source: Eurosystem
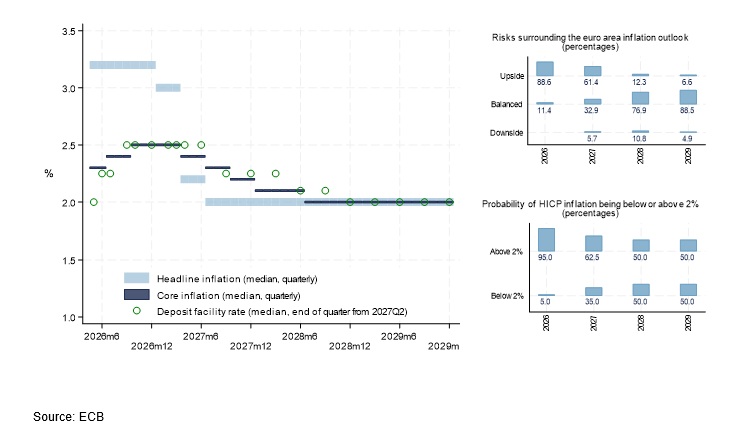
Survey evidence collected ahead of the June 2026 Governing Council meeting suggested that analysts expected above-target headline inflation in 2026 and the first half of 2027 and core inflation to exceed 2% until 2028Q2 (median responses). Also, the June 2026 ECB Survey of Monetary Analysts reported median expectations of both above-target inflation and higher policy rates (including a 25 bps hike in June). Moreover, a majority of respondents saw upside risks surrounding the inflation outlook in 2026 and 2027 (Graph 3 below).[8]
Graph 3: ECB Deposit facility rate expectations, inflation expectations and risk assessment according to the June 2026 ECB Survey of Monetary Analysts
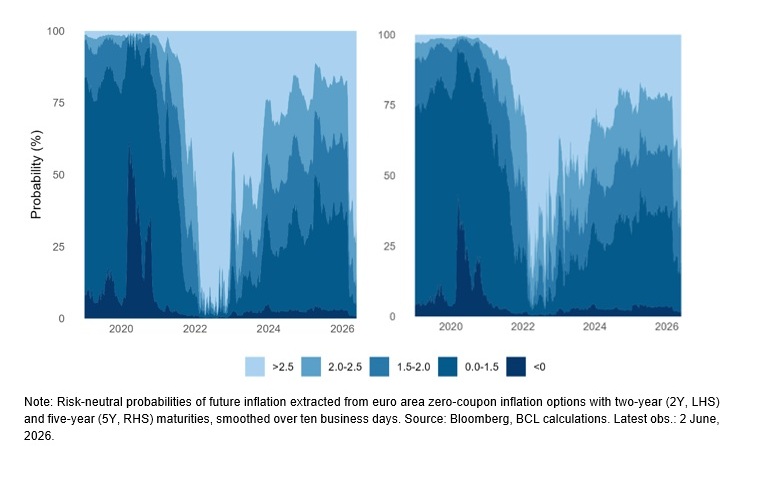
Other indicators, such as forward-looking market-based measures also pointed to upside risks to inflation. Risk-neutral densities derived from prices of inflation options using data up to early June (Graph 4) suggested market participants assigned much greater weight to inflation outcomes above 2%, particularly in the shorter-term.[9] Around mid-May, the five-year probability mass assigned to outcomes above 2.5% reached 50%, before declining to 35% ahead of the June Governing Council meeting. Also, despite futures curves pointing to some easing in oil and gas prices, risk-neutral densities derived from oil and gas options assigned a substantial probability to adverse energy‑price outcomes.
Graph 4: Market-based measures of risks to inflation (2-year and 5-year maturities)
Overall, the evidence available at the June Governing Council meeting suggested broad agreement about the prospect of above-target headline inflation in 2026 and 2027 as well as of core inflation exceeding 2% in 2026, 2027 and 2028. Within the context of Eurosystem/ECB staff projections, such a prolonged period of above-target headline and core inflation is not common, especially when considering the implied tighter monetary policy conveyed by market expectations and reflected in the technical assumptions. Moreover, this outlook would also imply core inflation remaining above 2% for seven consecutive years (i.e. from 2022 to 2028), unprecedented in the history of the euro area.
At the time of the June 2026 Governing Council meeting higher inflation stemming from the energy price shock was no longer merely projected but had materialised, with the data available prior to the June Governing Council meeting signalling strong first-round direct effects as well as increasingly visible and broader indirect effects on non-energy inflation.[10]
According to the May Eurostat flash estimate released ahead of the June meeting, euro area inflation increased from 3% in April 2026 to 3.2% in May 2026, its highest level since September 2023 and almost double the rate recorded in January 2026 (i.e. 1.7%).[11] The rise in oil prices linked to the war in the Middle East and the closure or disruption of key supply routes remained the main driver of higher inflation. According to Eurostat’s flash estimate, core inflation also rose, from 2.2% in April to 2.5% in May,[12] possibly suggesting indirect effects from higher energy prices. The rise in core inflation owed to both higher non-energy industrial goods inflation (from 0.8% in April to 0.9% in May) and a large rise in services inflation (from 3% in April to 3.5% in May).
The most common measures of underlying inflation, intended to capture more persistent inflation trends, remained within a relatively narrow range of 2.2% to 2.6%, above their respective pre-COVID averages. While no broad common trend was evident across indicators, the PCCI (Persistent and Common Component of Inflation) measures increased notably in March and April 2026.[13]
Supply chain pressures also increased, reflected in longer delivery times and rising backlogs of orders. Import and producer prices pointed to early signals of pipeline consumer price pressures. The global nature of the latest price shock raised the risk of larger indirect effects through import prices and along global value chains. In April 2026 (latest data point available at the time of the June Governing Council meeting), import and producer price inflation of industrial and intermediate goods sharply increased.[14] A more granular look at industrial producer prices showed a notable shift in the distribution since the start of the war in the Middle East. The share of components with annual price increases of 1% or less declined from almost 55% to below 40%, while the share of sub-indices recording price increases of more than 3% rose from 11% to 23%. At the same time, the distribution remained far less tilted towards large price increases than during 2022-2023.
Graph 5: Indicators of first-round effects
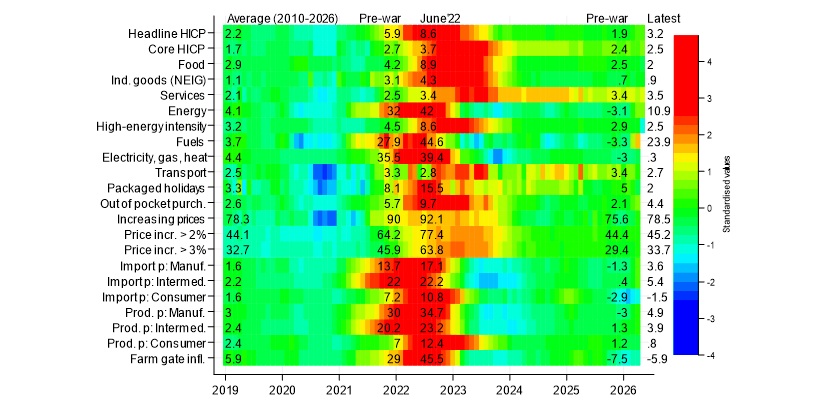
Note: Underlying series are annual inflation rates at monthly frequency except for the indicators capturing the share of HICP items with inflation above a certain threshold. Labelled values in the chart correspond to the latest 2026 observations, June 2022, the readings immediately preceding both the war in the Middle East and the Russian invasion of Ukraine, and the sample mean. Colour coding based on standardised values (z‑scores) over the 2010–2026 sample. The first twelve rows correspond to euro area HICP aggregates/subcategories published by Eurostat with the exception of high-energy-intensive items, which are identified using the UK Office of National Statistics’ energy-intensity classification mapped into ECOICOP v2 and applied to euro area HICP (see “The energy intensity of the Consumer Prices Index: 2022”). “Increasing prices” denotes the percentage of the most disaggregated HICP COICOP product items with positive annual inflation. “Price incr. > x%” refers to the percentage of disaggregated product items with annual inflation above x%. Euro area farm gate price inflation sourced from the ECB.
Source: Eurostat, ECB, ONS, BCL calculations. Latest obs.: May 2026 (HICP flash estimates) and April 2026 (granular HIPC data, producer and import price inflation and farm gate inflation).
At the time of the June meeting, the euro area labour market remained resilient, although with signs of cooling and with wage indicators pointing to moderation in the near-term. The ECB’s wage tracker and surveys on wage expectations indicated easing wage pressures, and staff revised down the projected growth in compensation per employee for 2026. Overall, the wage outlook remained consistent with inflation at target over the medium term.
At the same time, market participants, professional forecasters, and consumers expected a temporary overshoot of the inflation target in 2026 and 2027. Short‑term market‑based inflation compensation increased markedly in March and April, but eased in May as oil prices declined. Longer‑term inflation compensation increased only modestly and remained close to 2%. Term‑structure models indicated that the earlier rise mainly reflected higher inflation term premia rather than changes in long-run inflation expectations.
Similarly, short‑term inflation expectations by professional forecasters (SPF) were revised up in 2026Q2, while long‑term expectations remained unchanged. According to the ECB Consumer Expectations Survey (CES), median inflation expectations stabilised in April after a sharp increase in March. Five‑year median consumer inflation expectations reached their historical high, but the series only begins in August 2022. The credibility of the ECB’s commitment to price stability remained solid and medium-to-longer term inflation expectations remained well anchored at the medium‑term target.
Firms’ selling price expectations pointed to potentially stronger output price pressures. After rising sharply in industry and retail in March and April 2026, the net balance of firms expecting price increases eased slightly in May. Nevertheless, firms’ selling price expectations remained well above their pre-pandemic highs.
No signs of second-round effects were evident from the data available prior to the June Governing Council meeting. That said, wages and longer-term inflation expectations tend to adjust slowly, and the risk of second-round effects can increase with the duration of the shock as it may become embedded in underlying inflation and in medium- and longer-term inflation expectations. Moreover, still mindful of the inflation surge in 2022, households and firms might adjust their wage-bargaining and price-setting behaviour more quickly and, given the size of the shock, the pass-through could also be non-linear.
Graph 6: Indicators of possible second-round effects
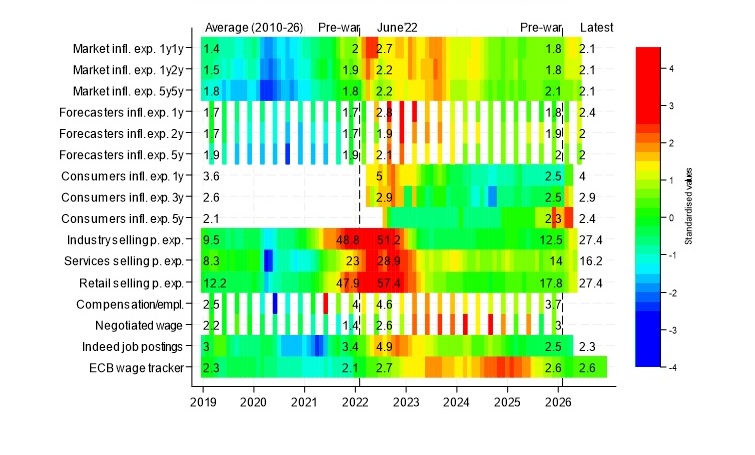
Note: Underlying series at monthly frequency except for professional forecasters’ expectations, compensation per employee and negotiated wage growth (all quarterly). Labelled values correspond to the latest 2026 observations, June 2022, the readings immediately preceding the war in the Middle East and the Russian invasion of Ukraine and a sample average. Colour coding based on standardised values (z‑scores) over the 2010–2026 sample. Market inflation expectations measure inflation compensation based on inflation-linked swaps. Forecasters’ inflation expectations are from the Survey of Professional Forecasters (SPF) at quarterly frequency. Selling price expectations from European Commission’s business surveys based on the net balance of firms expecting rising prices and those expecting declining prices. Consumer inflation expectations are median expectations from the ECB’s Consumer Expectations Survey (CES) and currently cover 11 countries. Indeed job posting is the 3-month moving average of online job offers on indeed.com. ECB wage tracker excludes one-off payments.
Source: Bloomberg, Eurostat, EC, ECB, BCL calculations. Latest obs.: June 2026 (ILS), 2026Q2 (SPF), April 2026 (CES, Indeed, ECB wage tracker, EC selling prices), 2025Q4 (compens./empl., negotiated wages).
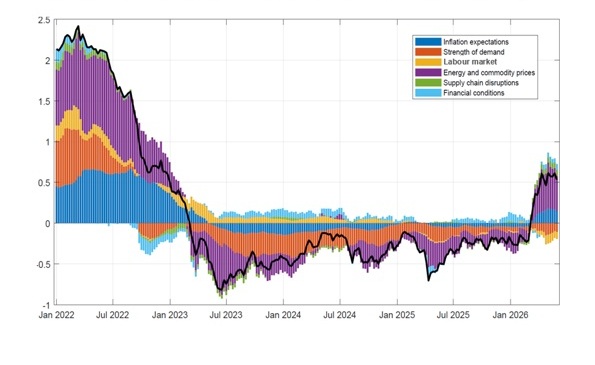
As discussed in the previous sections, the strength of the pass-through of energy commodity prices to consumer prices is determined by various factors, including inflation expectations of firms and households, the strength of demand, the tightness of the labour market, the evolution of energy and other commodity prices, the presence/magnitude of supply chain disruptions and financial conditions. In order to help assessing these effects, Graph 7 below shows a weekly BCL index of pass-through conditions in the euro area that aggregates weekly, monthly, and quarterly indicators across these dimensions.
With data available up to 30 May, the weekly index suggested a potentially significant pass-through of the 2026 energy price shock, even if much less strong than during the 2022 inflation surge. Unlike in 2022, when robust pent-up demand in the post-pandemic period contributed to strong pass-through conditions, demand conditions in early 2026 remained relatively weak.
Graph 7: Main drivers of a weekly index of pass-through since 2022
Sources: Bloomberg, European Commission’s Business and Consumer Surveys and Weekly Oil Bulletin, ECB, Eurostat, OECD, IMF, International Energy Agency (IEA), Aggregated Gas Storage Inventory (AGSI) of Gas Infrastructure Europe, Federal Reserve Bank of New York, PortWatch, BCL calculations. The index is estimated with a mixed-frequency dynamic factor model, following the work of Baumeister et al. (2024). See Baumeister, C., Leiva-León, D., and Sims, E., “Tracking weekly state-level economic conditions”, The Review of Economics and Statistics, March 2024, Vol. 106(2). Latest obs.: 30 May 2026.
Besides its assessment of the inflation outlook and the risks surrounding it, in light of the incoming economic and financial data, as well as the dynamics of underlying inflation, the Governing Council’s interest rate decisions also reflect the strength of monetary policy transmission.
Graph 8: Euro area monetary policy transmission heatmap
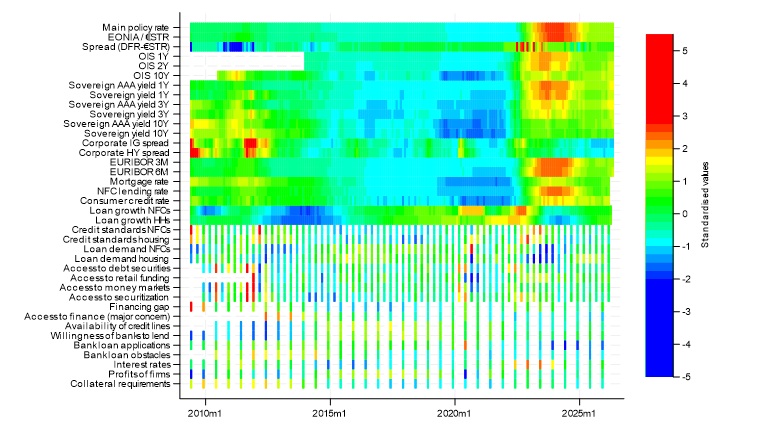
Notes: The heatmap summarises indicators of monetary policy stance and transmission in the euro area. Values are standardised (z-scores). Variables include the main ECB policy rate (MRO prior to October 2008 and the DFR thereafter), the spread between the main policy rate and the overnight money market rate (EONIA/€STR), short- and long-term risk-free interest rates (OIS at 1-, 2- and 10-year maturities), euro area AAA-rated and all sovereign yields (at 1-, 3- and 10-year maturities), corporate bond yields (option-adjusted spread) for investment-grade and high-yield issuers, money market rates (Euribor 3- and 6-month), bank lending rates to households (mortgages and consumer credit) and non-financial corporations (NFCs), credit growth to households and NFCs, Bank Lending Survey indicators on credit standards (consumer credit or business lending) and loan demand for NFCs and housing loans, as well as banks' access to retail and wholesale funding (deterioration in access), and SAFE indicators including the financing gap, the share of firms reporting access to finance as a major concern (a problem scoring at least seven on a scale of one to ten), the availability of credit lines, banks’ willingness to provide credit, bank loan applications and obstacles to obtaining a bank loan, level of interest rates for bank loans, collateral requirements for bank loans and firms’ profits. The overnight money market rate is constructed by merging EONIA with €STR from January 2022 onwards, reflecting the transition to the new euro short-term rate. The financing gap is defined as the difference between the net percentage of firms reporting an increase/decrease in the need for bank loans and those reporting improved/weakened availability of bank loans.
Source: Bloomberg, ECB, BCL calculations. Latest obs.: 4 June 2026.
After the outbreak of the war in the Middle East, short-term interest rates increased as markets had priced a relatively tighter monetary policy expected to address the rising price pressures. Higher long-term interest rates since the onset of the war reflected both higher inflation expectations and rising real interest rates. Rising interest rates and tightening of bank lending standards could lower credit demand, but bank-based monetary policy transmission continued to function smoothly. And while market-based transmission was affected by investor risk appetite, which could change swiftly, by the time of the June 2026 Governing Council there were no signs of an impaired monetary policy transmission.
BCL monetary policy simulations take staff macroeconomic projections as the reference point and combine them with impulse responses from macroeconomic models to trace how hypothetical alternative policy rate paths could affect the economy over time. [15] These alternative policy paths are then evaluated using a simple metric consistent with the ECB’s mandate. While highly stylised and illustrative in nature, such simulation exercises can complement the broad-based assessment of the outlook for price stability.
Internal BCL simulations conducted prior to the June Governing Council meeting suggested a 25 bps rate hike was a measured and robust step towards stabilising inflation at the 2% medium-term target. The figure below illustrates this by comparing the baseline inflation projection - embedding market expectations of a rate hike - with a hypothetical counterfactual scenario in which the short-term interest rate is 25 bps below the technical assumptions in the June staff projections in 2026Q3. From then on, accounting also for the Governing Council’s meeting-by-meeting approach, the rate path converges gradually and monotonically back to those technical assumptions, at a pace determined by the macroeconomic models used in the analysis.
The hypothetical alternative rate path would have implied an inflation profile slightly higher than the baseline projection. It could have resulted in a larger inflation overshoot in the near-term. Moreover, it might also have weakened the prospect for stabilising inflation at the 2% target in the medium-term.
Graph 9: Inflation profiles: Baseline scenario and hypothetical counterfactual (illustration)
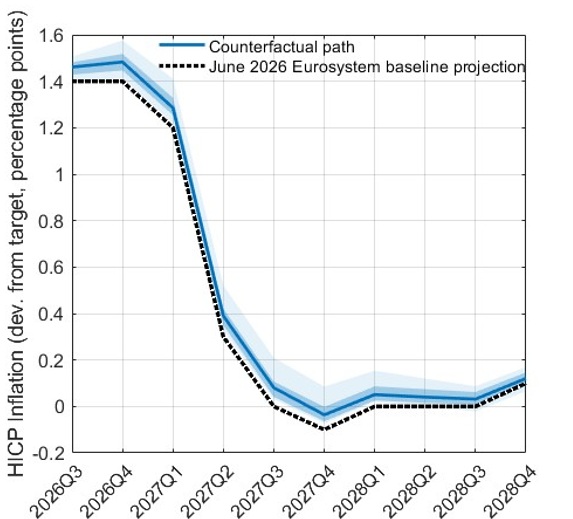
Note: BCL simulations. Illustrative counterfactual inflation paths shown as percentage-point deviations from the 2% inflation target. The dotted black line denotes the baseline projection for headline HICP inflation. The solid line shows the median projected inflation path - derived from a set of macroeconomic models - assuming the short-term interest rate is 25 bps below the technical assumptions in the June staff projections in 2026Q3 and then converges gradually and monotonically back to those technical assumptions. The darker shaded area shows the 20th to 80th percentile range of inflation trajectories across models, while the lighter shaded area shows the full range.
Simulation exercises conducted within the BCL ahead of the June 2026 Governing Council meeting suggested that a 25 bps rate hike in June was an appropriate measure – also relative to a policy of no rate change – not only for the baseline scenario, but also for the alternative illustrative staff scenarios. A moderate hike limited the larger inflation overhang projected in the event of an escalation of the war (as reflected in the adverse and severe scenarios) while not requiring an early reversal of the rate increase in the event of a swifter resolution of the war (as reflected in the milder scenario). Moreover, the 25 bps rate hike in June was also robust to the exact modelling of the Governing Council’s preferences (including, for instance, genuine “inflation nutter” preferences on the one hand or incorporating some considerations to economic activity and/or interest rate smoothing on the other hand).
This blog post, finalised on 2 July 2026, highlights developments and considerations that informed the Governing Council’s deliberations at its June 2026 monetary policy meeting based on the June 2026 staff projections and the data available at that time.
The June staff projections implied a marked upward revision to headline and core inflation for 2026 and 2027. Staff projected above-target headline inflation for 2026 and 2027. Core inflation was projected to remain above 2% for projection years, which would lead to an exceptionally long period of elevated core inflation since 2022. This prospect of above-target inflation for a significant period of time was in line with forecasts by other institutions and private sector expectations. Moreover, staff projections themselves were based on market expectations of rate hikes prevailing at the cut-off date and the range of scenario and sensitivity analyses suggested upside risks to the inflation outlook. Furthermore, higher inflation was no longer merely projected but had already materialised, with the incoming data signalling first-round direct effects and increasingly visible broader indirect effects on non-energy inflation.
Against this background, the Governing Council assessed that looking through the current energy price shock was no longer appropriate. Instead, committed to setting monetary policy to ensure that inflation stabilises at the 2% medium-term target, the Governing Council decided to increase the interest rates on the deposit facility, the main refinancing operations and the marginal lending facility to 2.25%, 2.40% and 2.65% respectively, with effect from 17 June 2026. The decision to raise key policy rates by 25 bps was a measured response, robust across a range of scenarios (including the milder scenario) and no mere insurance hike. It contributes to contain indirect effects and risks of second-round effects, thereby supporting the credibility of the ECB’s price stability commitment and fostering the solid anchoring of medium and longer-term inflation expectations. Consistent with the assessment of the latest energy shock triggering a sizeable, though not too persistent inflation overshoot (unlike the inflation surge in 2022), this measured response should leave the Governing Council well positioned to navigate the uncertainty caused by the war in the Middle East, evaluate the incoming data and maintain flexibility.
The blog post has been finalised on 2 July 2026 and deliberately abstracts from developments and data releases that materialised after the June 2026 Governing Council meeting. The implications of more recent developments for the inflation outlook will be assessed at the forthcoming July 2026 Governing Council meeting.
Attentive monitoring of the size and persistence of energy price increases and its implications for price and wage-setting, inflation expectations, aggregate demand, core and underlying inflation, monetary policy transmission, as well as financial conditions is warranted. Interest rate decisions will continue to be based on the Governing Council’s three-pronged reaction function, including its assessment of the inflation outlook and the risks surrounding it, in light of the incoming economic and financial data, the dynamics of underlying inflation and the strength of monetary policy transmission. The Governing Council also continues to follow a data-dependent, meeting-by-meeting approach to determining the appropriate monetary policy stance without pre-committing to a particular rate path.
Firmly committed to delivering 2% inflation over the medium term, the Governing Council remains agile and flexible, standing ready to adjust all of its instruments within its mandate to ensure that inflation stabilises sustainably at its target and to preserve the smooth functioning of monetary policy transmission.
_________________________________________________
[1] I would like to thank Sara Ferreira Filipe, Pablo García Sánchez, Patrick Lünnemann, Ladislav Wintr and Arina Wischnewsky for support in preparing this article.
[2] The cut-off date for the global economy projections was 20 May 2026, for the technical assumptions 21 May 2026 and for the euro area macroeconomic projections 27 May 2026.
[3] The baseline and the alternative scenarios assumed euro short-term interest rates to evolve in line with market expectations as derived from futures markets. Similar to the baseline scenario, the alternative scenarios include fiscal measures that have passed or are likely to pass the legislative process.
[4] The technical assumptions cover, among others, the future path of market interest rates (short-term and long-term), exchange rates (bilateral EUR/USD exchange rate and the nominal effective exchange rate of the euro against the currencies of the euro area’s main trading partners), oil prices, natural gas prices, wholesale electricity prices, international food commodity prices and non-energy commodity prices. A forthcoming blog post will provide details on the role and the definition of technical assumptions.
[5] Based on then prevailing market expectations, the March 2026 staff projections assumed the 3-month Euribor to stand at 2.3% in 2026 and 2.6% in 2027 and 2028. Hence, the upward revision to inflation in June 2026 took place despite an assumed higher path of short-term interest rates, as expected by markets and reflected in the technical assumptions, than in the March 2026 projection exercise.
[6] The 3‑month Euribor is a money‑market rate that reflects the expected cost of unsecured interbank borrowing over the next three months, embedding the current level of current key ECB interest rates, market expectations of future ECB decisions and risk premia. The correlation between the 3-month Euribor and the ECB key policy rate exceeds 98% (based on daily data since January 1999).
[7] The technical assumptions of staff projections assume energy commodity prices to evolve in line with prevailing market expectations derived from prices of energy future contracts as well as constant exchange rates (as of the cut-off date). In the context of the regular sensitivity analysis, risks are analysed using lower and higher paths for oil and gas prices as well as for the USD/EUR exchange rate derived from percentiles of the respective option-implied neutral densities. The regular sensitivity analysis also includes an alternative constant price path for oil and gas.
[8] June 2026 ECB Survey of Monetary Analysts
[9] The charts show the risk-neutral probabilities of average euro area HICP inflation over the next 2 and 5 years, grouped into five brackets. These probabilities are inferred from prices of zero-coupon inflation caps and floors with different strike rates. A cap pays when inflation exceeds its strike, a floor pays when inflation falls below it. Such options, thus, provide insurance against inflation outcomes. Comparing prices across strikes rates allows deriving risk-neutral distributions under the no-arbitrage option-pricing framework. No-arbitrage implies that an option cannot generate a risk-free profit relative to a portfolio replicating its payoff.
[10] First‑round direct effects capture the immediate pass‑through to HICP energy items, reflected in higher retail prices for electricity, gas and fuels. First‑round indirect effects arise from the mechanical increase in production costs for firms that use energy as an input, feeding into non‑energy goods and services. Second‑round effects, discussed in the next section, emerge when these initial price changes trigger behavioural adjustments in wage‑ and price‑setting, potentially amplifying and prolonging the shock’s impact on underlying inflation dynamics.
[11] The flash estimate of 3.2% year-on-year headline inflation for May 2026 was confirmed by the final release on 17 June 2026.
[12] 2.6% according to the final numbers released after the June Governing Council meeting.
[13] The PCCIs are model-based measures designed to filter out volatile components of inflation. During the 2022-2023 inflation spike, headline PCCI increased earlier than other measures of underlying inflation.
[14] At the same time, producer price inflation for non-durable and consumer goods decelerated in April.
[15] For details, please refer to Régis Barnichon & Geert Mesters (2023). "A Sufficient Statistics Approach for Macro Policy", American Economic Review, American Economic Association, vol. 113(11), pages 2809-2845.